Nagios Integration
This page is for administrators who already run Nagios and want the health of their Device42 appliance monitored alongside the rest of their infrastructure. By the end, Nagios reports Device42 health data as standard service checks.
Device42 offers a Nagios plugin for Device42. It is available for download via Github, and allows easy monitoring of the health status of your Device42 appliance. Data returned includes:
The plugin is available on GitHub and returns the following data:
- Device42 database size
- Appliance disk space usage
- Memory usage
- CPU usage
Prerequisites
Before installing the plugin, make sure you have:
- A running Nagios server, with access to its plugin and configuration directories
giton the Nagios server to clone the plugin repository- The required Perl packages installed, as shown below
On Ubuntu:
apt-get install libnagios-plugin-perl libjson-perl libwww-perl
On Red Hat:
yum install perl-JSON.noarch perl-Nagios-Plugin.noarch
Install the Nagios Add-On
To install the Nagios plugin, clone the repository to your nagios server, e.g.:
git clone https://github.com/device42/Device42-Nagios-Health-Check
Copy the check_d42_health.pl file to your Nagios plugin directory:
cp check_d42_health.pl /usr/local/nagios/libexec/
Make it executable:
chmod +x /usr/local/nagios/libexec/check_d42_health.pl
Copy the d42.cfg file to your Nagios configuration path (for example, /usr/local/nagios/etc/objects):
cp d42.cfg /usr/local/nagios/etc/objects
Edit d42.cfg and customize the following lines, starting on line 30:
define host{
  host_name  device42 # if you edit the hostname, be sure to edit the hostname in the services defined as well
  alias      device42
  address    192.168.11.211
Use SSL with the Integration
To enable checking over SSL, add the port number with the -P option and --ssl in the Health Check Command section of d42.cfg:
command_line /usr/bin/perl $USER1$/check_d42_health.pl -H $HOSTADDRESS$ -I $ARG1$ -w $ARG2$ -c $ARG3$ -P 4343 --ssl
Add Device42 to Nagios
With the scripts in place and configured, edit your nagios.cfg file and add a line to include the Device42 configuration:
cfg_file=/usr/local/nagios/etc/objects/d42.cfg
Update the path to match where you placed the d42.cfg file, then restart Nagios:
service nagios restart
After restarting, browse to Nagios to see your Device42 instance reporting health information.
View Device42 Health Status in Nagios
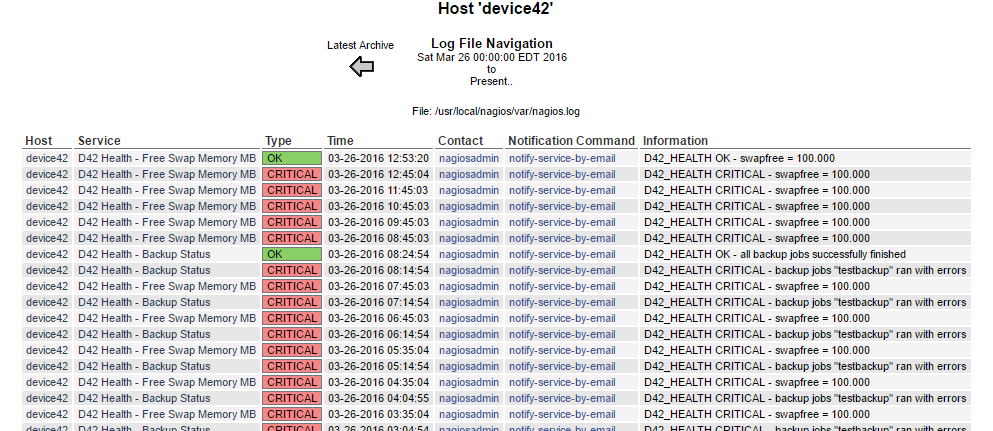
When you select the Device42 host from Nagios, you can see the appliance's current status via the various health checks:

The Backup Status check reports an error if any one of your backup jobs has failed. The free disk space, memory, and swap statuses have thresholds that you can set in d42.cfg. When setting the thresholds, 50 triggers the flag if the value is greater than 50, while 50: triggers the flag if the value is less than 50.
The following are suggested thresholds for the default Device42 disk size (50 GB HDD) and default allotted memory (4 GB RAM). If your appliance uses different settings, configure these values accordingly:
| Health Check | Warning Threshold | Critical Threshold |
|---|---|---|
cpu_used_percent | 85 | 95 |
dbsize | 1000 | 2000 |
disk_used_percent | 60 | 80 |
memtotal | <= 4000 | <= 3000 |
cached | ||
swapfree | <=15% | <= 5% |
swaptotal | <= 2000 | <= 1000 |
memfree | <=15% | <=10% |
buffers |
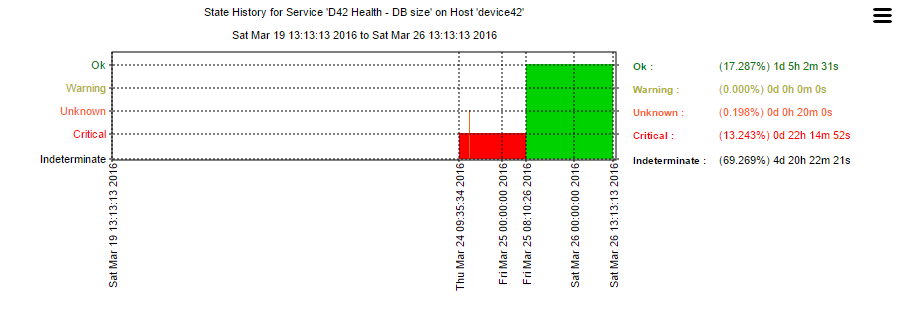
You can also view the trending data for any health stat by clicking the service and then View Trending Data for this Service.
A log of all statuses is available for the host by clicking View Notifications for this Host.