External Logging Config
This page is for administrators who want their Device42 audit log events to appear in the external logging or SIEM platform their organization already uses. It explains how to send those events to platforms like Splunk or Logstash using webhooks, so you can search and report on them there.
Prerequisites
Before configuring external logging, make sure you have:
- Access to Device42 to add webhook endpoints and actions under Tools > Webhooks
- An external logging or SIEM platform, such as Splunk or Logstash, with administrator access to configure a data input
- An HTTP plugin or input installed on that platform, as described in Install an HTTP Plugin below
- Network connectivity from Device42 to your logging platform on the listening port you configure
- For Splunk, an HTTP Event Collector (HEC) token and a randomly generated UUID for the request channel header
Install an HTTP Plugin
You will need an HTTP plugin for Logstash or Splunk to send data to the SIEM or logging platform of your choice. Find the downloads at the following links:
Splunk: https://dev.splunk.com/view/event-collector/SP-CAAAE6M
Logstash:https://www.elastic.co/guide/en/logstash/current/plugins-inputs-http.html
Configure External Logging
Webhooks are the best way to get your logs from Device42 to your external logging platform. Begin by setting up a webhook endpoint:
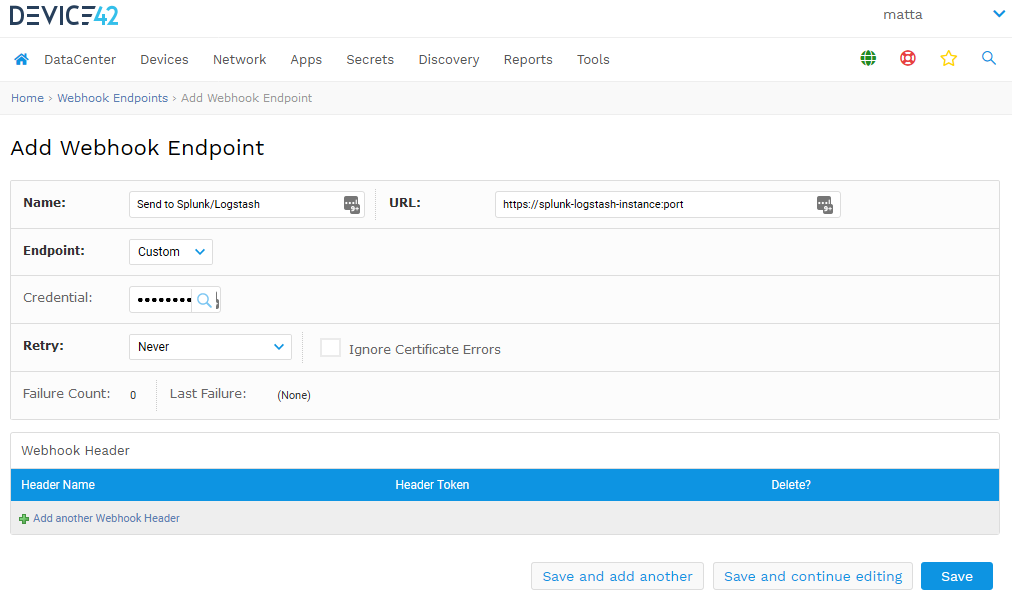
- Begin by navigating to Tools > Webhooks > Endpoints. Your Splunk or Logstash instance is your endpoint. From this page, click the Add Webhook Endpoint button in the upper right (highlighted):
Integration with External Logging Systems
Device42 can be integrated with external logging or SIEM systems, such as Splunk or Logstash, with the use of webhooks. Webhooks are a methodology of sending server-side details or events to a receiving client-side application, and are also known as reverse APIs. Device42 can send audit log events in the form of webhooks to these other platforms for external analysis.
The following sections walk through setting up this integration using Splunk Enterprise as an example. To get started, navigate to Tools > Webhooks > Endpoints (your Splunk or Logstash instance is the endpoint) and click Add Webhook Endpoint.
Configure an HTTP Event Collector (HEC) in Splunk
To catch the webhooks Device42 produces, configure an HTTP Event Collector (HEC) in Splunk:
- Navigate to Settings > Data > Data Inputs > HTTP Event Collector.
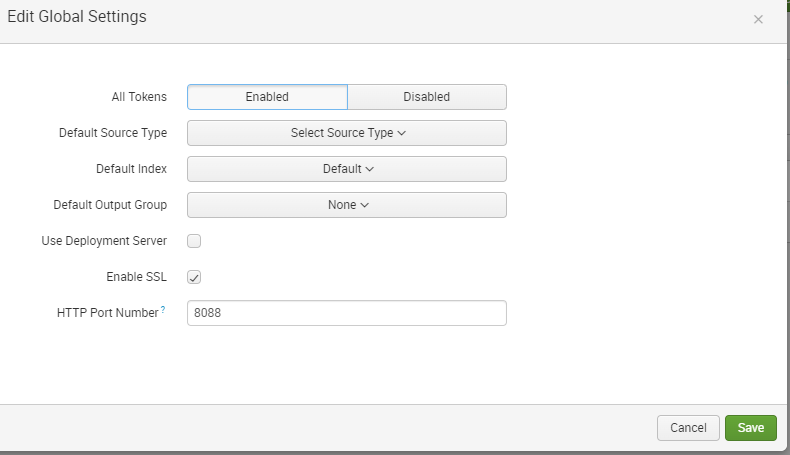
- Click Global Settings in the upper-right corner and select Enabled for All Tokens, determine if SSL needs to be enabled, and define the HEC listening port number (
8088is used in this demonstration), then click Save.
 3. Create a new HEC token by clicking New Token in the upper-right corner. Give it a Name and an optional Description or Source Name Override (
D42_Webhooks is the example created here). Click Next to display the Input Settings, where you define optional input parameters for source type and index. Change Source type to Select, enter json in the filter, and select _json.
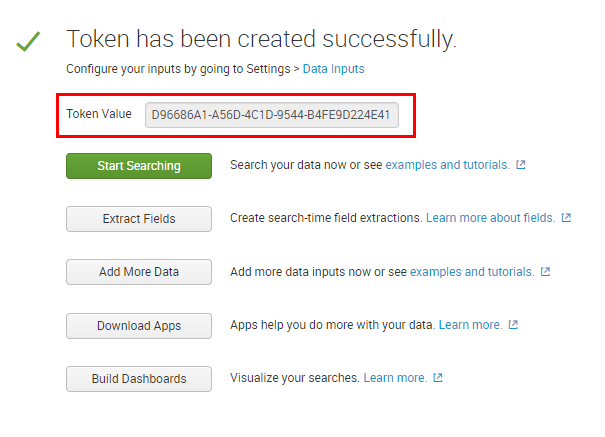
4. Click Review and then Submit to create the HEC. This provides a token value. Take note of it, though it is available later if needed.
Configure a Webhook Endpoint in Device42
Define a webhook endpoint in Device42 to receive the audit log events and forward them to the HEC configured in Splunk.
- Navigate to Tools > Webhooks > Endpoints > Add Webhook Endpoint.
- Name the endpoint and define the endpoint URL like
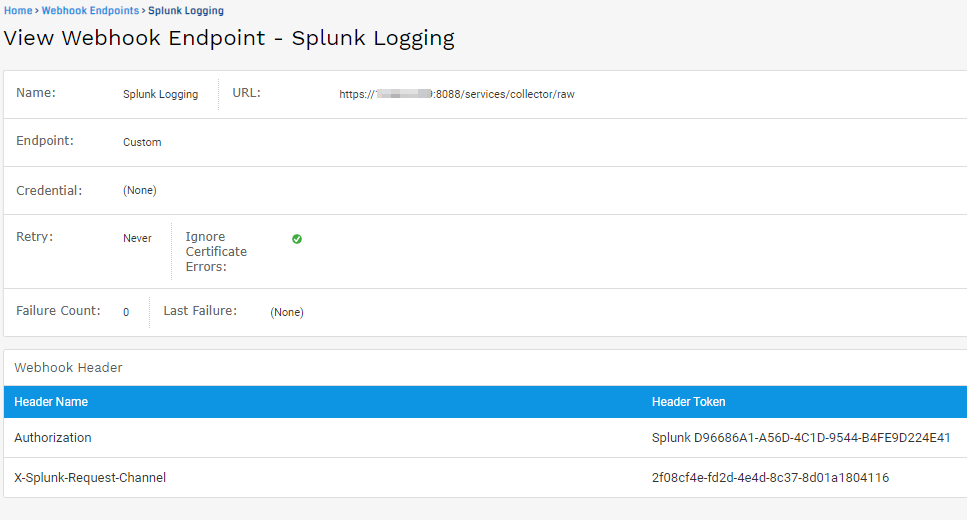
https://ENDPOINT-URL:HEC-PORT/services/collector/raw. The endpoint used in this example ishttps://10.42.2.239:8088/services/collector/raw. Depending on the HEC settings, http or https may need to be defined. The services/collector/raw REST API endpoint is where Device42 is sending the raw json data to the HEC. - Leave the Endpoint value as the default Custom, define credentials if required (not used in this demonstration), set a Retry interval, and select Ignore SSL Certificate Errors if necessary.
- Define two Webhook Headers. The first has a Header Name of
Authorization, with a Header Token ofSplunk <HEC Token>, where<HEC Token>is the HEC token value created earlier in Splunk. - The second has a Header Name of
X-Splunk-Request-Channelwith a Header Token of a randomly generated UUID. You can create one with a Linux utility such asuuidgen. TheX-Splunk-Request-Channelheader field is required because the request sent to the HEC includes raw data.

The following screenshot shows a completed webhook endpoint configuration:
Create a Webhook Action in Device42
- Navigate to Tools > Webhooks > Actions > Add Webhook Action.
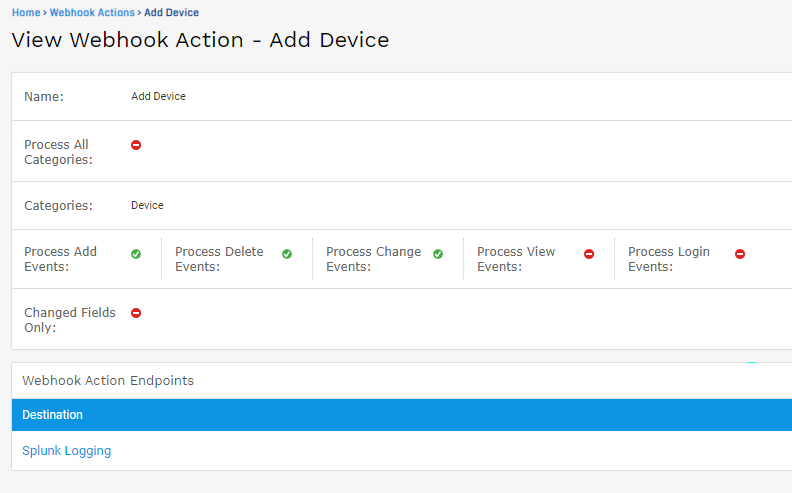
- Give the Webhook Action a Name, select the categories to create webhooks for, then define whether add, delete, change, view, and login events are delivered. Alternatively, select Process All Categories to deliver all webhook types.
- Select the Webhook Action Endpoint, which should be the endpoint or endpoints created in the step above. The example here processes Add, Delete, and Change events for the Device object in Device42. As a test, a Splunk Logging Device was created, changed, and deleted.
-
Navigate to Tools > Webhooks > Actions > Add Webhook Action.
-
Give the Webhook Action a name, select the categories to create webhooks for, then define whether add, delete, change, view, or login events are delivered. Alternatively, select Process All Categories to deliver all webhook types.
-
Select the Webhook Action Endpoint created in the previous step. This example processes Add, Delete, and Change events for the Device object in Device42.
-
After webhooks have been processed and sent to Splunk, you can search for them through Settings > Knowledge > Searches, Reports, and Alerts > New Report.
-
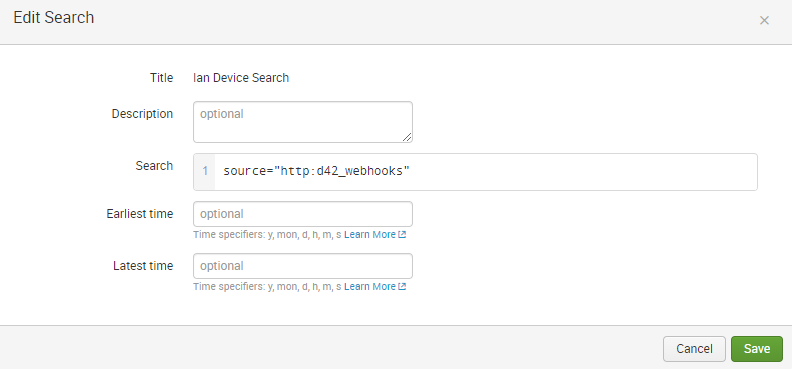
Title your report, enter search parameters, and configure any optional settings as needed. The example here uses
source="http:d42_webhooks"as input and looks only for events caught by the HEC configured earlier.
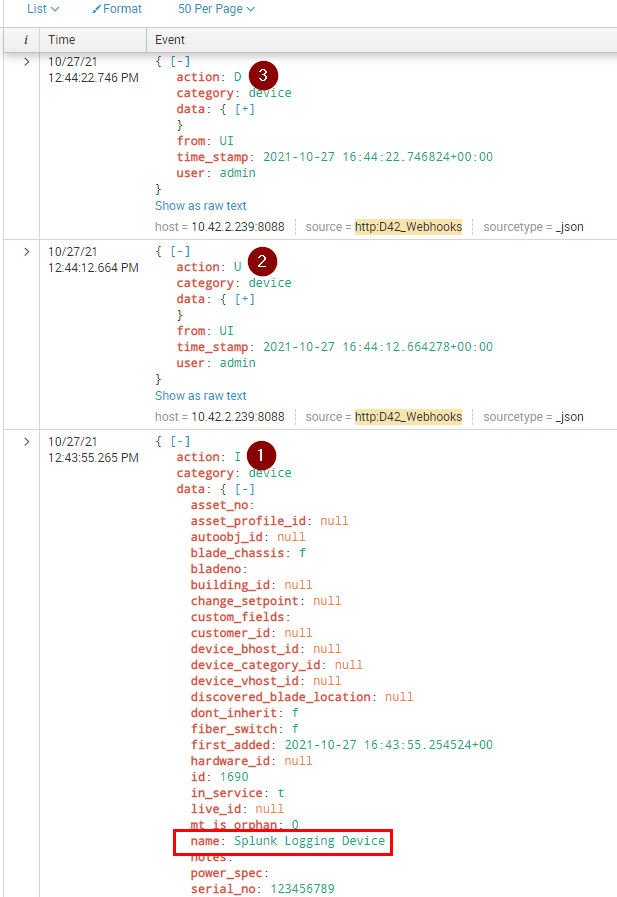
 3. Save the report, then click Run from the resulting Searches, Reports, and Alerts list view. The three events below indicate that the Splunk Logging Device was inserted (created), updated (changed), and deleted, shown by the
 I, U, and D actions respectively.
Configure Log Storage Duration
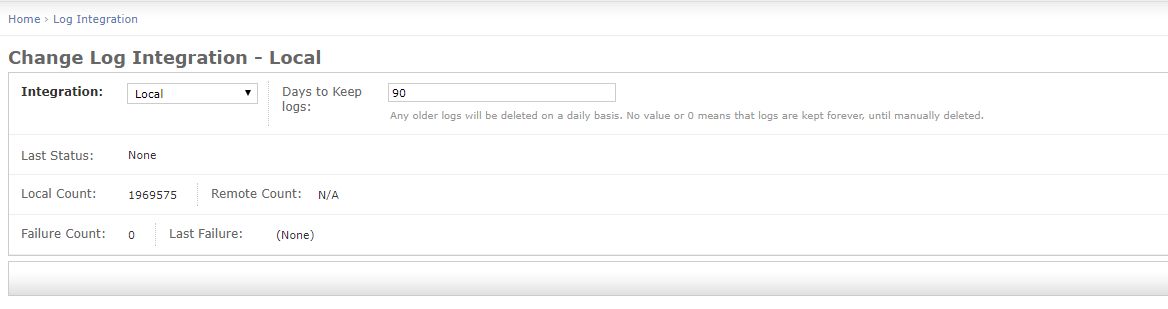
You can also navigate to Tools > Settings > Log Integration to choose how long you want to keep logs in your log solution to save space.